
The campaign archive contains all the statistics on all delivered campaigns. The main screen of this area shows a list of all the campaigns deployed up until that moment. To see test campaigns as well, select “all”. To see just the campaigns associated with a specific group, use the “group filter” drop-down menu (see fig. 1).
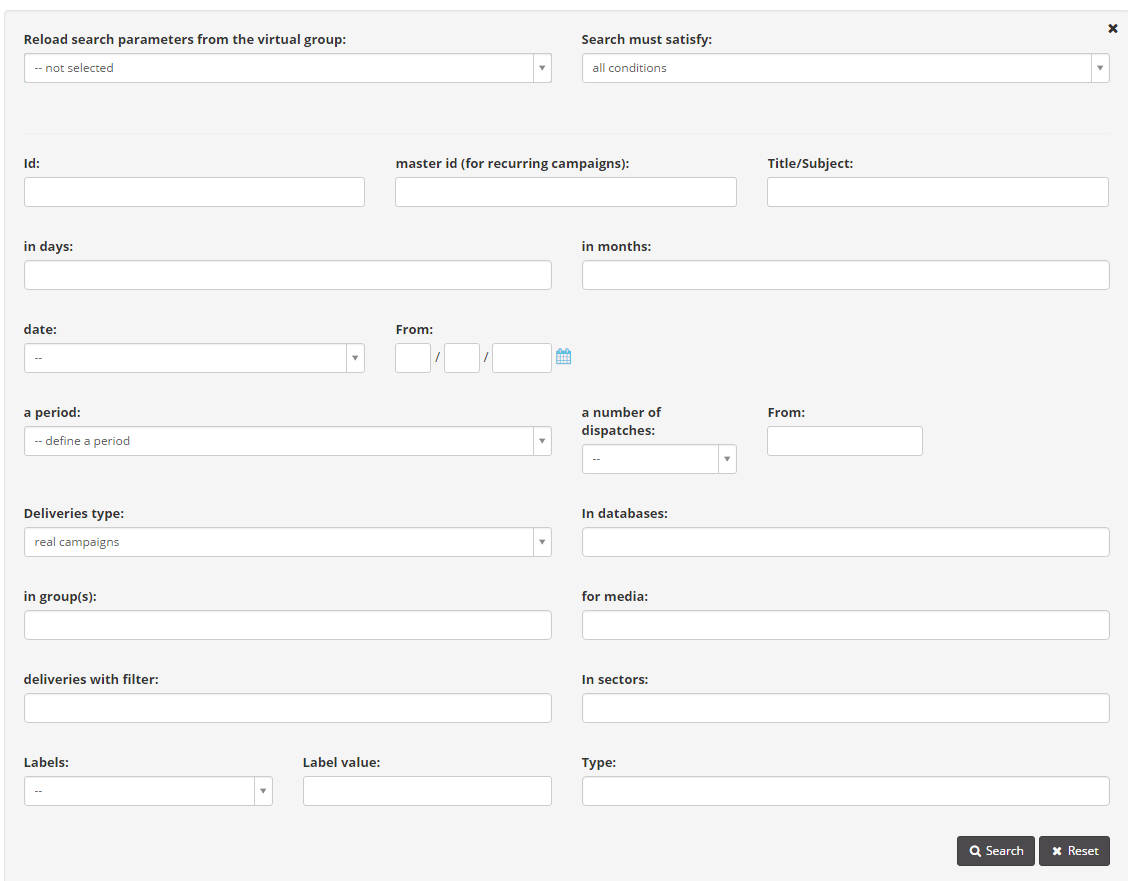
Figure 1: Campaign archive. The search engine is at the top. The drop-down menu can be used to filter campaigns by group.
The search engine at the top can be used to find a campaign according to various criteria: Subject of campaign or title, Delivery date (complete or partial: just day, just Month or just year), ID, period, categories etc.
Labels are used to create customised search criteria. One or more labels with a specific can be applied at each campaign.
For example, suppose a company delivers group X on behalf of various customers. At each campaign associated with group X, it may create a “Customer_name” label with a different value for each customer (Customer_name=Tomato, Customer_name=Google, Customer_name=Pippo Ltd., etc…).
When searching for group X campaigns performed for Pippo Ltd., simply use search by label as a criterion, select the Customer_name label and enter “Pippo” as the keyword.
To insert new labels or manage existing ones, click on the post-it icon in the “Labels” column next to the subject of the campaign (fig. 2).
To access the statistics of a delivery, click on the preview (or in “List details” on the object).
To access campaign statistics, click on the campaign subject.
Campaign statistics are divided into sheets:
In the “Bounced”, “Opens” and “Links” sheets, click on “Users table” to show, on request, the “Download user list – detailed extraction” button.
Press this button to download the list of users who have performed the action (i.e.: those who have not received the mail if they are on the “Bounced” sheet, those who have opened the mail or those who have clicked on the links) in the “detailed” mode.
As well as user emails, extraction in the detailed mode will also count the other visible fields (cf. chap. Configure –> User DB).
Visible fields mean those fields made visible from the database control panel in the Configuration > Field management sheet. When a detailed extraction is requested, the system associates the “visible fields” currently in the database with each user.
ATTENTION: Detailed extraction is only valid if the database associated with the group is the same as it was when the campaign was delivered. If delivery was made using a db and another db was later associated with the group, there is no point in making a detailed extraction. This is because the users list registered in the statistics would no longer match the users in the database and the visible fields would therefore be associated with the wrong user.
This sheet contains a summary of campaign data and statistics about delivered and bounced emails, bounce reasons, the number of opened emails and link tracking (fig. 4b).
In this section you can change the title of the delivery if it was specified during the creation or set it if it was not previously indicated (fig 4a).
Description and meaning of the campaign list sheet:
| Name | CSV field name | Description | Values |
|---|---|---|---|
| Campaign ID | id_delivery | Campaign ID (id_delivery): numerid id of a campaign | numeric |
| Newsletter (Email Group) | newsletter | Newsletter (newsletter): email group name | text |
| Subject | subject | Subject (subject): campaign subject line | text |
| Bounces | bounce | Bounces (bounce): number of recipients which bounced back | numeric |
| Sent | users | Sent (users): number of recipients selected for sending (including bounces, blacklisted and invalid addresses) | numeric |
| Date | delivery_date | Date (delivery_date): sending date of the delivery | date |
| Campaign type | test | Campaign type (test): If a campagn is marked as a test or a real sending to external recipients | 0:REAL 1:TEST |
| Medium | medium | Medium (medium) : EMAIL / SMS | 0:EMAIL 1:SMS |
| Campaign filter ID | qualifier_id | Campaign filter ID (qualifier_id): numeric id of the destination filter | numeric ( 0 = all recipients) |
| Database ID | userdb_id | Database ID (userdb_id): numeric id of the user database | numeric |
| Industry Category ID | category_id | Industry Category ID (category_id): numeric id of the primary industry category | numeric ( 0 = undefined) |
| Number of domains | num_domains | Number of domains (num_domains): number of different domains among recipients | numeric |
| Delivered | delivered | Delivered (delivered): number of deliverd messages (‘sent’ -bounced -blacklisted -errors) | numeric |
| Cancelled | cancelled | Cancelled (cancelled): number of messages not sent due to a manual stop of a sending | numeric |
| Feedback loop | fbl | Feedback loop (fbl): Number of feedback loops | numeric |
| Abuse | abuse | Abuse (abuse): number of abuse reports | numeric |
| List unsubscribe | listunsubscribe | List unsubscribe (listunsubscribe): number of users which used the ‘list-unsubscribe’ parameter (see Blacklist in Send user guide) | numeric |
| Already blacklisted | blacklist | Already blacklisted (blacklist): number of users in the permanent blacklist when the campaign was sent | numeric |
| Temporary blacklist | blacklist_temp | Temporary blacklist (blacklist_temp): Users already in the temporary blacklist when campaign was sent | numeric |
| Errors | error | Errors (error): Number of errors (addresses mispelled or msgs with internal problems) | numeric |
| Unique opens | view_u | Unique opens (view_u): Number of unique opens (people who opened the msg) | numeric |
| Total opens | view_r | Total opens (view_r): Number of total opens (one person could open more times) | numeric |
| Hidden opens | view_h | Hidden opens (view_h): Number of hidden opens (did not download msg images but clicked a link) | numeric |
| Opens from webmail | view_wm | Opens from webmail (view_wm): number of opens from a web mailbox | numeric |
| Opens from online version | view_ovu | Opens from online version (view_ovu): number of opens from mobile version | numeric |
| Opens from mobile | view_mobile | Opens from mobile (view_mobile): number of opens from a mobile device | numeric |
| Unique clicks | click_u | Unique clicks (click_u): number of unique clicks | numeric |
| Total clicks | click_r | Total clicks (click_r): number of total clicks | numeric |
| Unique tell-a-friend | taf_u | Unique tell-a-friend (taf_u) | numeric |
| Total tell-a-friend | taf_r | Total tell-a-friend (taf_r) | numeric |
| Unsubscriptions | unsubscribe | Unsubscriptions (unsubscribe): number of users who unsubscribed via Contactsend link | numeric |
| User profile updates | updates | User profile updates (updates): number of users who updated their db fields via Contactsend link | numeric |
| Users put in temporary blacklist | blacklisting_temp | Users put in temporary blacklist (blacklisting_temp): number of addresses put in the temporary internal suppression list | numeric |
| Users put in permanent blacklist | blacklisting_final | Users put in permanent blacklist (blacklisting_final): number of addresses put in the permanent internal suppression list | numeric |
| Labels | etichette | Labels (etichette): List of labels applied to a campaign | text |
| Title | title | Title (title): campaign title | text |
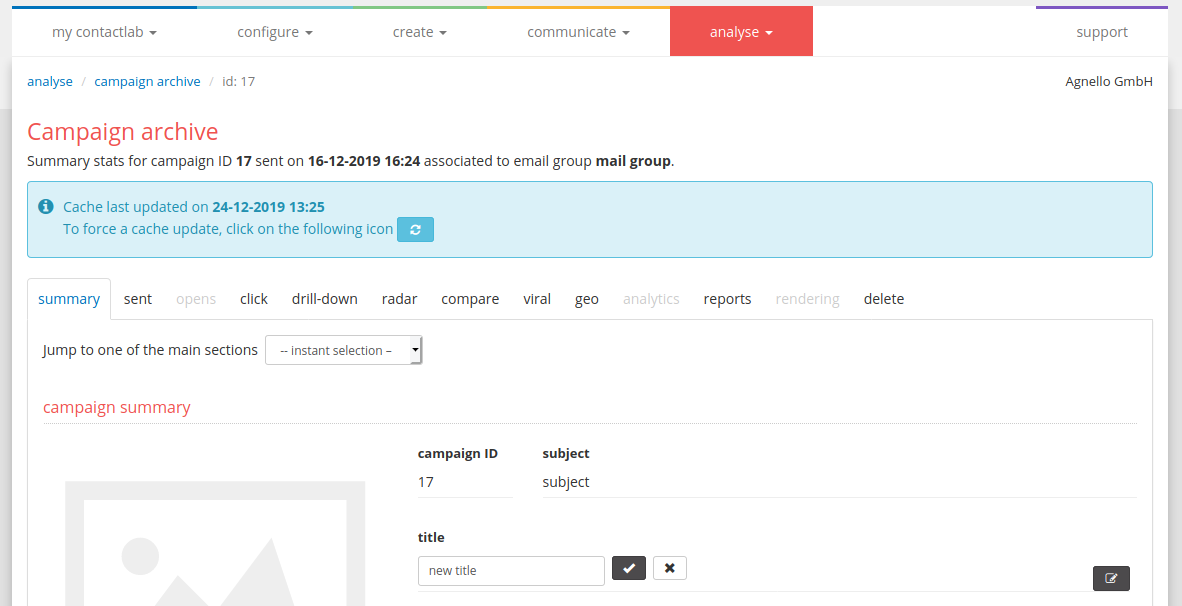
Figure 4b
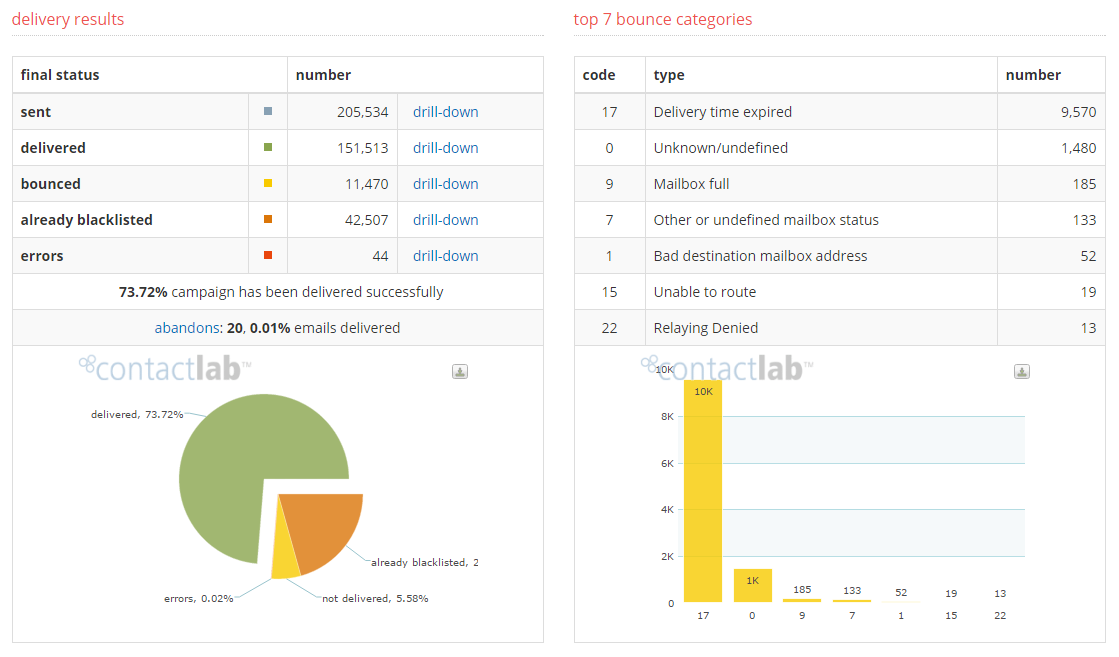
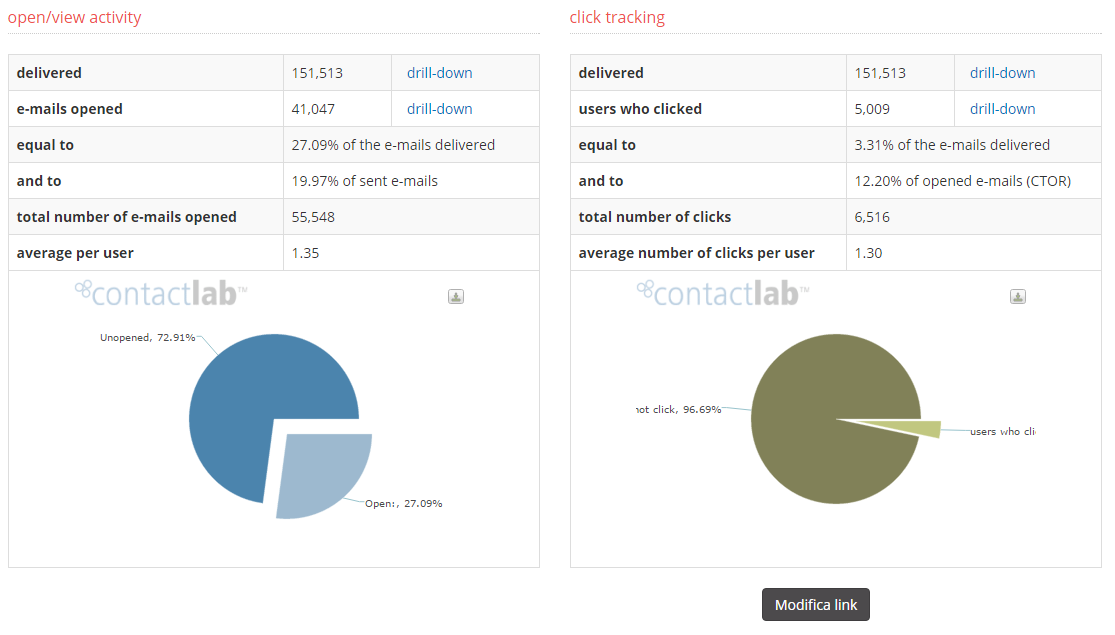 Figure 4b
The sent emails chart shows how many messages were deployed, how many bounced and indicates any errors. The chart to the side instead illustrates the main reasons why the emails bounced (mailbox full, mailbox inexistent, server down, etc…)
The last two pie-charts show the percentage of emails opened by the users and the relative link tracking. The data “User who clicked” is based on unique users.
Category
You can associate each delivery to a products and services preset category. The categorization by sector is very important especially if you send messages about their various fields. You can even collect statistics on the distribution by category of deliveries made.
Customers using the planner (see chap. Building> Planning) and have the functionality “planning behavioral” actived, among other criteria will select users that have opened or clicked on a number of times a certain period of time shipments belonging to a particular sector.
Instant preview on different clients
Here you can use the instant preview service to check how this message is displayed on different email clients and operating systems. If you click the View preview button, you retrieve the latest preview generated for that email message. In case you made changes after you had generated that latest preview, the preview may be different from the email actually sent to your recipients.
You can retrieve previews with 90 days from their generation date. Alternatively, you can generate a fresh new preview via the Force a new preview button. Further details in this page.
This tab shows data about Emails sent. The “Sent”, “Delivered”, “Bounced”, “Errors”, “Blacklist”, “abandons” submenus contain the relative charts and detailed statistics.
Sent: This area illustrates data relative to the emails sent. It comprises: a chart showing the emails sent by domain; a “users table” listing the individual users, email addresses and domains to which the emails were sent (fig. 6).
Delivered: This area illustrates data relative to the emails delivered. It comprises a chart showing the emails sent by domain and a “users table” listing the individual users, email addresses and domains to which the emails were sent.
Bounced: This sheet contains the statistics relative to bounced emails.
The most important sheet is probably the first which lists and charts the reasons for the bounced emails. The “By domain” sheet, instead, shows the number of bounced messages by domain. Lastly, the users table lists of bounced users.
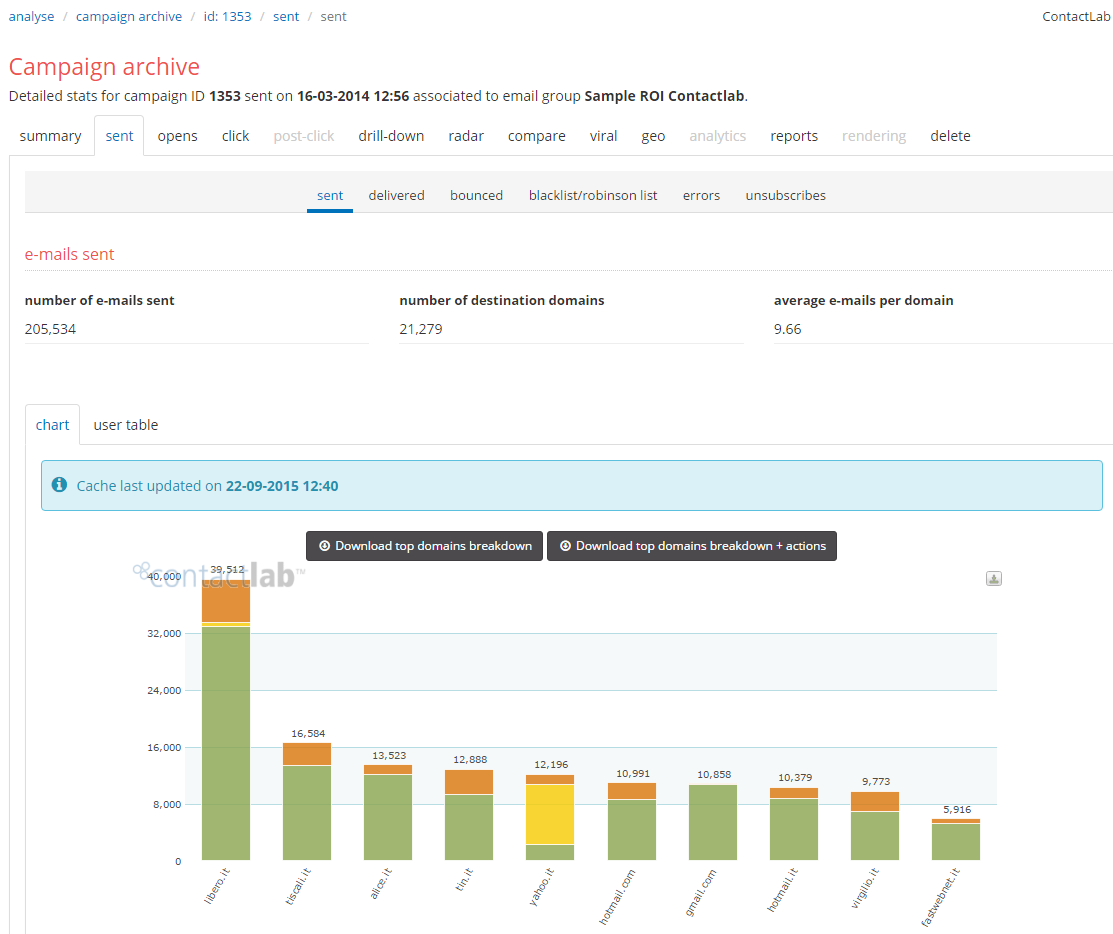 Figure 6
Here are some bounce error codes:
- 0: Unknown/undefined
- 1: Bad destination mailbox address
- 2: Bad destination system address
- 3: Bad destination mailbox address syntax
- 4: Mailbox has moved
- 5: Bad sender’s mailbox address syntax
- 6: Bad sender’s system address
- 7: Other or undefined mailbox status
- 8: Mailbox disabled, not accepting messages
- 9: Mailbox full
- 10: Message length exceeds administrative limit
- 11: Mail system full
- 12: No answer from host
- 13: Bad connection
- 14: Routing server failure
- 15: Unable to route
- 17: Delivery time expired
- 16: Routing loop detected
- 19: Invalid command
- 18: Other or undefined protocol status
- 21: Delivery not authorized, message refused
- 20: Syntax error
- 23: Service not available – access denied
- 22: Relaying Denied
- 24: Message considered to be spam
Errors: This sheet indicates any delivery errors. Only very special events that rarely occur are classified as errors;
e.g.:
| • | During dispatch, an email address is missing from the database due to a cancellation or an unsubscription. |
| • | The data queued for delivery does not match the data in the database. E.g.: if, after queuing a campaign for delivery, its database is modified by associating an e-mail address with another ID. |
Blacklist: This area contains the messages that were not sent because they were inserted in the ContactLab Blacklist.
Abandons: Here it will be summarized the various reasons of “abandons” of a user: unsubscribe, list unsubscribe, feedback loops, abuse
Opens: This sheet contains statistics on opened emails.
How does ContactLab know when an email has effectively been opened?
A small code referring to a “spy image” is automatically inserted in each message leaving the platform: this tiny image, 1 pixel x 1 pixel, invisible to the final user, is uploaded together with all the other images when the message is opened. The URL to reach for this tracking image is in secure protocol HTTPS. When the spy image is loaded, the relative server registers it, thus allowing ContactLab to know that the email has been opened.
Of course, if the spy image is not uploaded for any reason, ContactLab will never know whether the message was been opened or not.Some mail programmes (Outlook, Thunderbird, etc.) and some webmails (Yahoo!, Gmal etc…) may block the images in emails in html format. If this block is not removed, ContactLab will be unable to know whether the message is opened.
Let us suppose, however, that the image block function has been enabled (therefore the images have not been uploaded), and the user clicks on a link inside the message. At this point, even if the spy image has not been loaded because of the block, ContactLab registers the click on the link: if the user has clicked on the link, it means he has opened the email! This open will therefore be registered in the relative “hidden opens” sheet.
The “Opens” sheet contains statistical data relative to:
- The percentage of the emails opened up until that moment, out of the total sent.
- The number of users who opened the message from a webmail and the number who downloaded the email on an email client (Outlook, Thunderbird…).
- The geographic distribution of users.
- A table containing the list of users who opened the message.
- The day/hour trend, showing the days of the week and the times when most opens took place.
Data on opens is shown in tables and charts (fig. 7).
The Webmail-Mobile tab shows opens from webmails and mobile devices (with their family and model).
Note: the mobile opens shown here are unique opens (people who opened), while the related csv report contains total mobile opens.
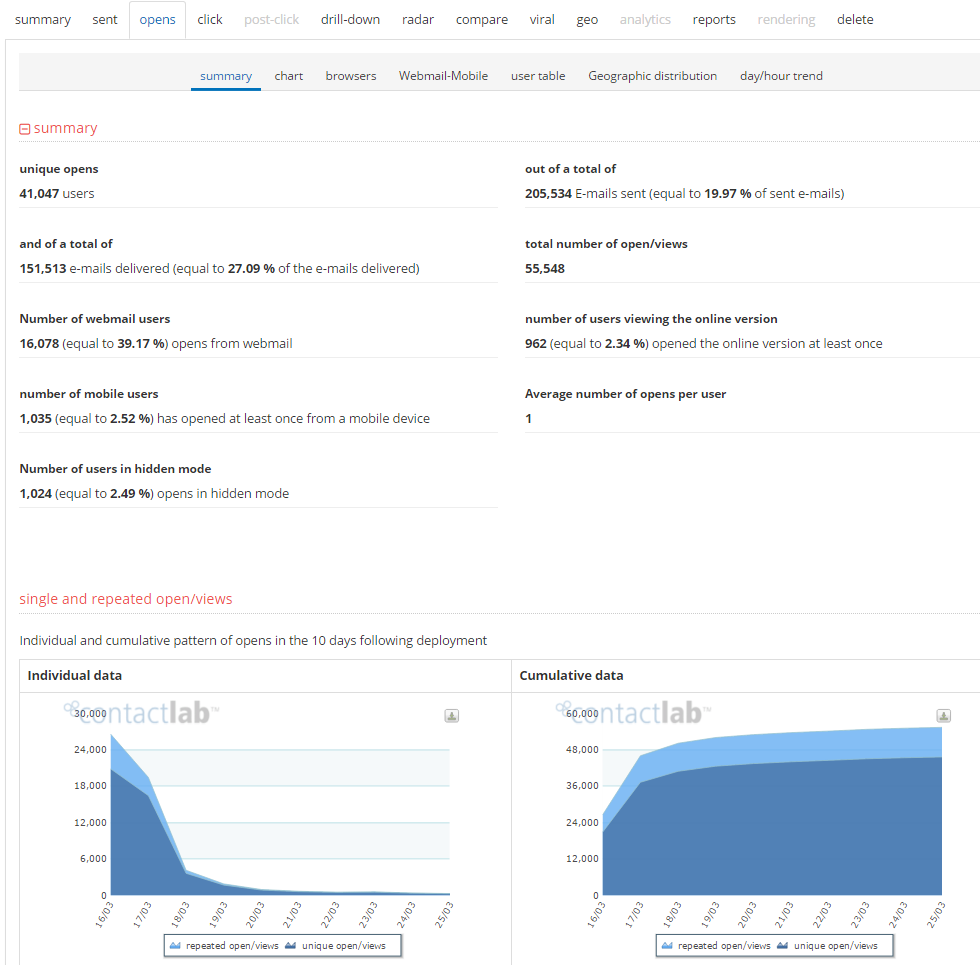
Figure 7
Links: This sheet concerns the links inside the message (fig. 6 below). Information includes: the number of links, the number of users clicking on them, the geographic distribution of the clicks, the categories of clicks.
Clicks are tracked by rewriting original link URLs in a tracking URL. Default tracking url root path is: https://t.contactlab.it/
| Click on “Simulation” for a graphic preview of the message with folders containing the relative statistics next to each link, (fig. to side). Each folder also shows the percentage of clicks on that link out of the total links in the text (how often a link has been clicked compared with others).
This makes it possible to visually control which areas of the text are more clicked than othersand “adjust” the layout of the contents accordingly. The data in simulation is based on unique click on link. |
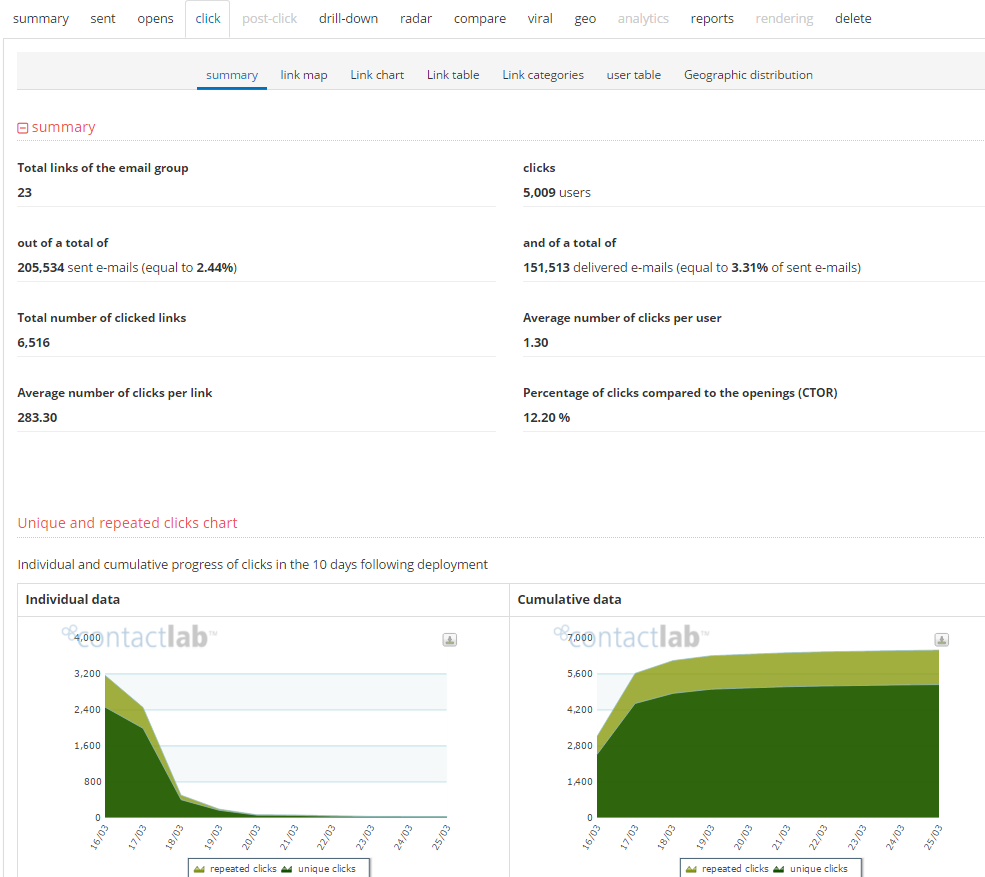
Figure 8: Summary of statistics on campaign link clicks
The “Simulation” sheet is followed by the “Links chart” (figure 9). This is a dynamic chart: it can be modified to show just the data you are interested in by opening the drop-down menu above it and clicking on “Display”.
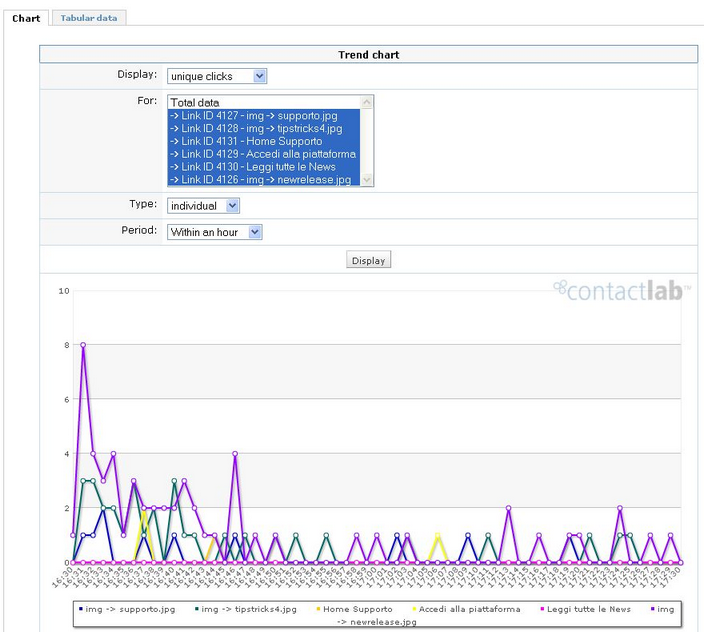
Figure 9
Let us see how to read and use the chart results.
| 1. | Display |
| • | Unique clicks: each user that clicks on a link at least once is considered just once (even if he clicks on 10 links, he will still be counted as 1).. |
| • | Repeated clicks: all the unique clicks are counted (even if a user clicks more than once on the same link). |
2. For
| • | Total data: this considers all the links in the campaign. |
| • | Unique link: you may choose one of the links, each identified by a numerical ID. |
3. Type
| • | Individual: this is the data relative to a chosen period of time (e.g.: a single day). |
| • | Cumulative: this is the cumulative data from the moment of delivery to today, bearing in mind therefore the clicks made during that period. |
4. Period: used to select the period you wish to monitor (12 hours, 1 day, 1 week, etc…)
The example in figure 7 shows the cumulative data of three links, each of which is shown on the chart in a different color.
As well as the chart, you may click on “tabular data” to view the numerical click data sorted in a table.
The “Links table ” sheet shows the links in the message (fig. 10). Along with the link ID and description, the table also shows the category it is associated with; click on the “change” icon ![]() to open a drop-down menu that can be used to change the associated category. To edit or create new categories, go to the “Configure > Categories” section. If a new category is associated, the registered clicks will not be lost but simply split into new categories.
to open a drop-down menu that can be used to change the associated category. To edit or create new categories, go to the “Configure > Categories” section. If a new category is associated, the registered clicks will not be lost but simply split into new categories.
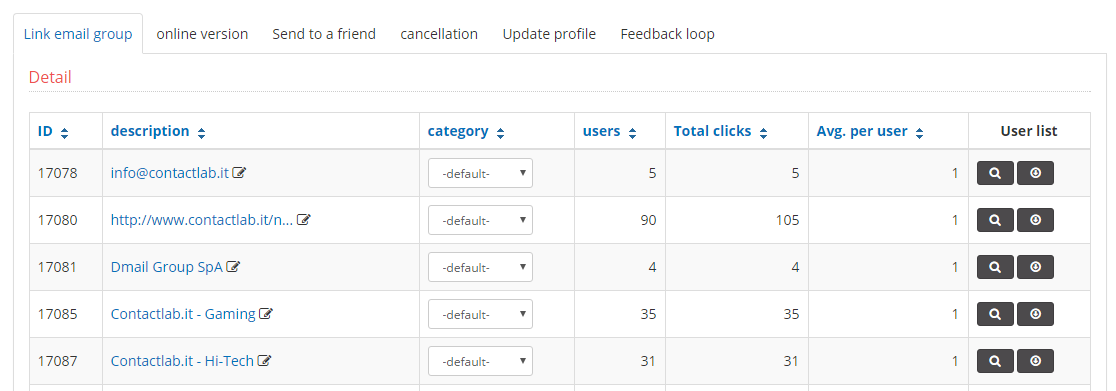
Figure 10
User data and the relative number of clicks are shown to the right of the categories.
In “modify link”you can change the destination URL of the tracked links in the email.
The “Links categories” sheet contains statistics concerning the various categories of links in order find out which category obtained the largest number of clicks in percentage terms. The statistics by category are split into 3 pie-charts (fig. 11):
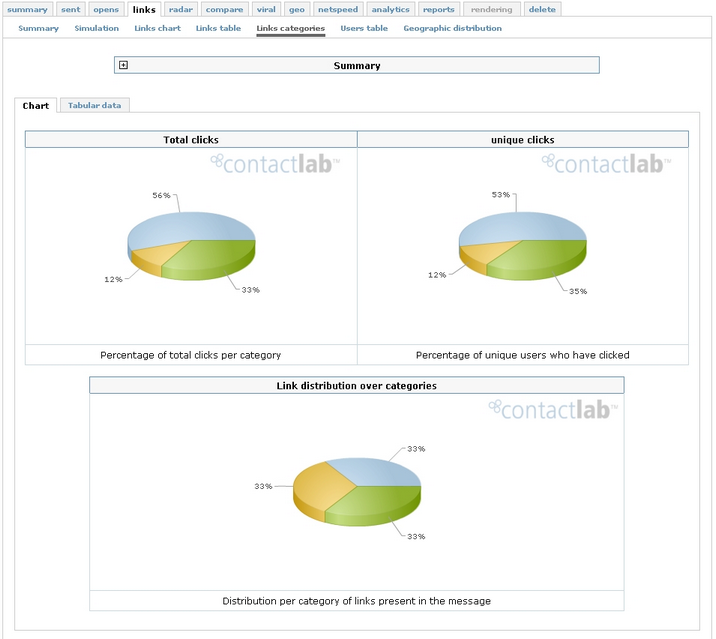
Figure 11: statistical data relative to link categories
The first chart at the top left, “Total clicks”, shows the percentage of total clicks (also comprising repeated clicks) for each category. The second, “Unique clicks” shows the percentage of unique clicks (without counting the clicks after the first one) for each category.
The last chart, “Link distribution over categories” shows the distribution of the links in the various categories (the number of links, in percentage terms, in each category).
In “Geographic distribution”, the clicks are split by Country.
Place the mouse over a country on the world map to display a message showing the number of clicks registered in that country and the percentage of total clicks.
A table listing the countries with the relative data is shown underneath. The data “Number of registered actions” is based on unique IP.
Radar: Enter the e-mail address of a user who has received the group to view the statistics relative to that user: if the campaign was received correctly, if it was opened, how many times and from what IP addresses/country, the links that were clicked on inside the group.
Compare: This tab compares the current campaign with another one selected from the list of all sent campaigns.
The two charts compare the current campaign with the selected one as regards unique opens and unique clicks. The values indicated in the charts are also listed in the tables in the “Absolute values”, “% of sent e-mails” and “% out delivered e-mails” sheets.
Viral: This tab checks any atypical behaviour in the emails sent, such as opens from different IP addresses, opens above average, clicks above average.
Geo: This tab splits the emails sent by country on a world map and in a table (similarly to the “Links > Geographic distribution” sheet, see above).
Netspeed: This tab shows the percentage of users using 56k modems, adsl lines, optic fibre lines, and so on…
Analytics: In this tab (if enabled) it is analyzed the conversion from newsletter in your web site. There is a preview of these data in the delivery summary (fig. 14)
In the analytics tab we have the details of the variables set in the javascripts and collected by the Analytics system of ContactLab, both numerically and chart
In the Conversions table you can analyze the data of behavior on your site for individual users, based on variables set
In visits table you can analyze the time that users spent visiting individual pages
The last tab provides the details of clicks of the delivery.
Reports: This tab shows all the reports relative to the various sheets: Summary, List of sent emails, List of delivered emails, List of bounced emails, and so on, so that those wishing to download one or more reports may do so without entering each separate sheet. Additionally, more advanced reports are available on request: behavioural analysis and detailed data reports. These two types of analysis are described in the following paragraphs
The list gives a description of the type of analysis contained in each report.
This report gives data relative to campaigns, opens, clicks on links divided by user profile.
The user profile is defined according to the “filter fields” set on the database.
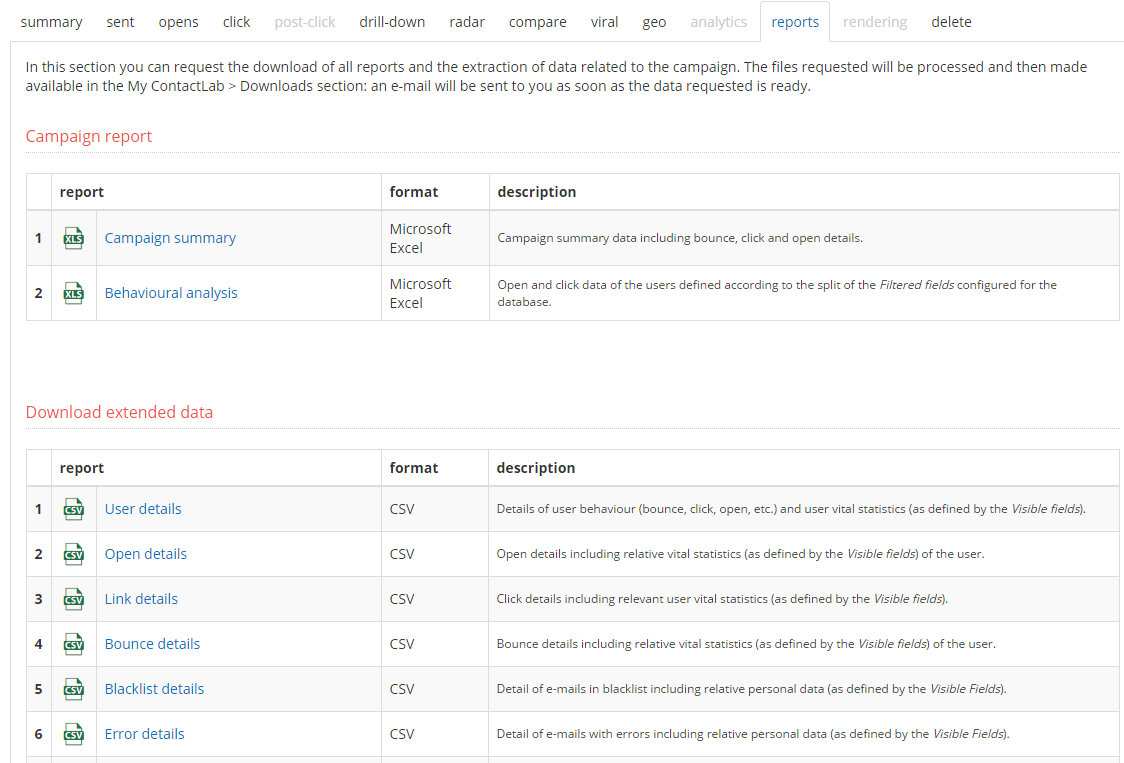
Figure 20
ATTENTION! Behavioural analysis is only valid if the database associated with the group is the same as it was when the campaign was delivered. If delivery was made using a db and another db was later associated with the group, there is no point in downloading this report. This is because the users list registered in the statistics would no longer match the users in the database and the visible fields would therefore be associated with the wrong user.
Download extended data
This series of reports is used to associate additional fields (the fields set as visible) with the list of required emails.
You can then download the list of users who have performed the action (i.e.: who did not received the mail, who opened the mail or who clicked on the links) in the “extended” mode.
As well as user emails, extraction in the extended mode will also count the other visible fields: e.g. Name, Surname, Company_Name, etc…
Visible fields are the fields that are made visible from the database control panel in the Configuration > Field Management sheet. When an extended extraction is requested, the system associates the “visible fields” currently in the database with each user.
ATTENTION! Extended extraction is only valid if the database associated with the group is the same as it was when the campaign was delivered. If delivery was made using a db and another db was later associated with the group, there is no point in making a detailed extraction. This is because the users list registered in the statistics would no longer match the users in the database and the visible fields would therefore be associated with the wrong user.
Here’s a description of the file fields:
cl_status: delivery status, meaning:
1 -> Delivered<br>
‐1 -> Bounced<br>
‐2 -> Error<br>
‐3 -> Permanent Blacklist<br>
‐4 -> Cancelled delivery (interrupted)<br>
‐5 -> Temporary Blacklist<br><br>

**cl_received** = email received<br><br>
**cl_bounced** = email bounced back<br><br>
**cl_blacklisted** = email in blacklist<br><br>
**cl_cancelled** = in case of interrupted sending<br><br>
**cl_error** = mispelled email address<br><br>
**cl_view** = email opened<br><br>
**cl_view_mobile** = email opened from mobile device<br><br>
**cl_click_u** = unique clicks<br><br>
**cl_click_t** = total clicks<br><br>
**DELIVERY_DATE**<br><br>
**__cls1** = subscription status field, where subscribed=1, unsubscribed =‐1<br><br>
**__cl_last_view** = date and time of last open<br><br>
**__cl_last_click** = date and time of last click<br><br>
In general, value 0 in the fields means 'no' while value 1 means 'yes'.<br>
Reports: here – for test campaigns only – previewss generated with the old preview system, available until Dec. 31 2017.
Delete: This tab is used to delete the archive of this campaign. Naturally, after deleting the campaign archive it will no longer be possible to retrieve and check the relative statistics.