
SmartRelay is one of the solution that ContactLab offers to customers who want to manage transactional messages,
computerizes messages or anyway generated automatically from their systems, by exploiting the sending infrastructure and
the offered advantages from a big email service provider.
SmartRelay is shown as an SMTP interface between messages generated and inserted from the user and the final recipients,
by adding a series of additional services and information such as bounce management, tracking on openings and an internal suppression-list.
Starting from June 2012, SmartRelay customers have a new front-end to analyze the trend and statistics of their own sending.
On Dashboard (fig 1) it is possible to graphically view the trend of sent emails and bounce in the last 25 days, so you can immediately see possible anomalies.
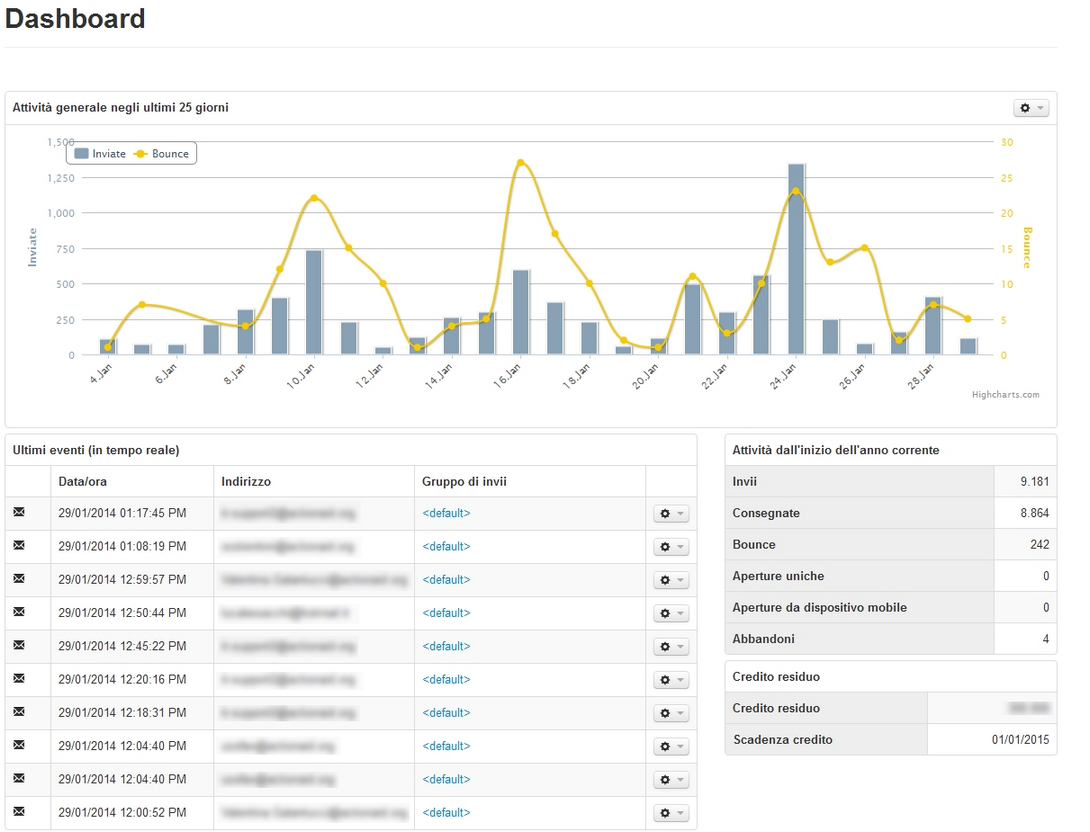
Fig 1
You can also view the last generated events (in real time) and a summary of the number of sent emails, delivered emails, bounce and opened emails related to current year. You can also view the remaining credit (number of emails to be sent).
In this area you can download the files requested in the different areas of the platform in the last seven days (ex. report).
You can also view pending or in execution request (the request can be deleted).
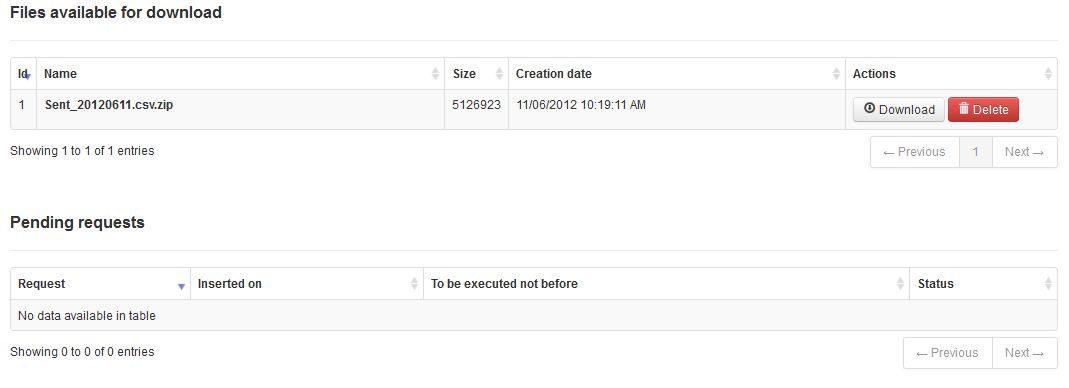
Fig 2
In the “User Profile” area it is possible to manage your own profile and possibly change your own email address that should be anyway confirmed through the appropriate activation link (fig.3).
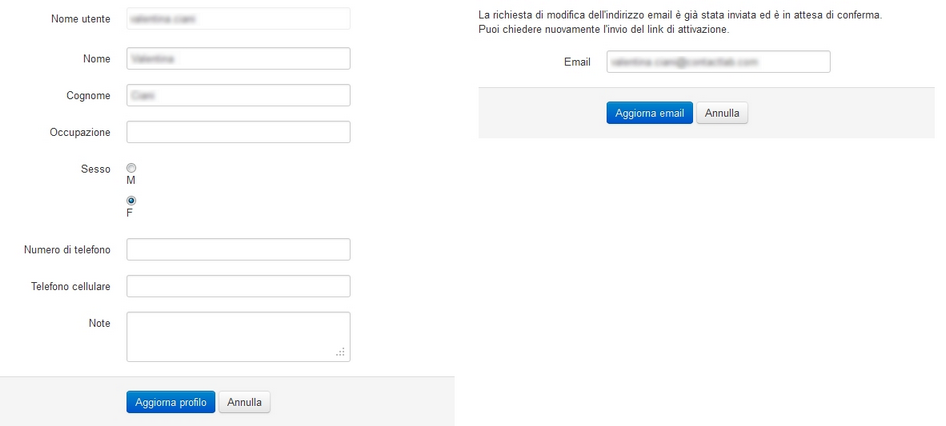
Fig 3
In the area “Password and secutiry options” you can change your password (fig. 4).
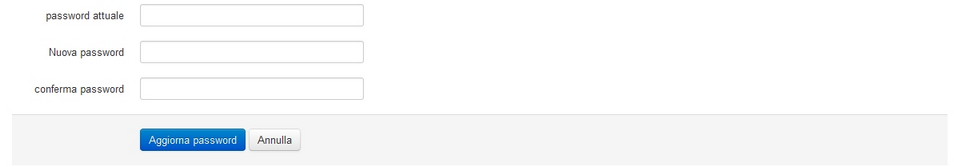
Fig 4
In the campaign archive you have all the stats for deliveries already sent out (fig. 5).
Fig 5
Delivery stats are organized into tabs:
Summary In this tab you find a recap of stats on messages delivered and not delivered, bounce reasons, open rate, and other information. (v. fig. 6) Other features:
- search engine “From date” > “To date” to find deliveries within a certain time frame
- image upload, associate an image to the sending group for better identification.
To access sending stats, click delivery Title.
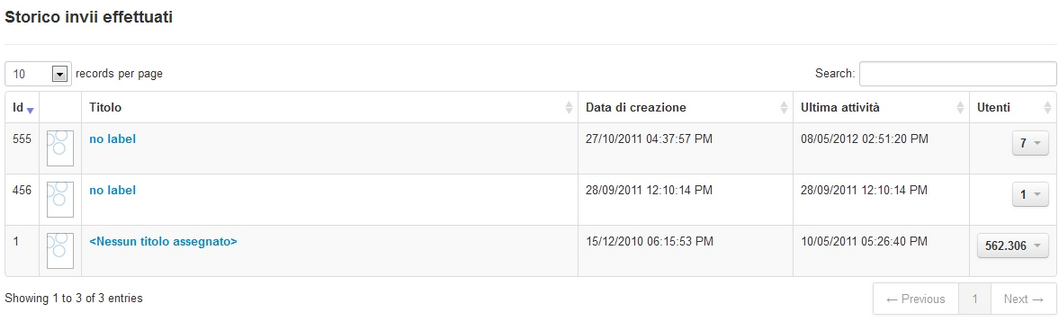
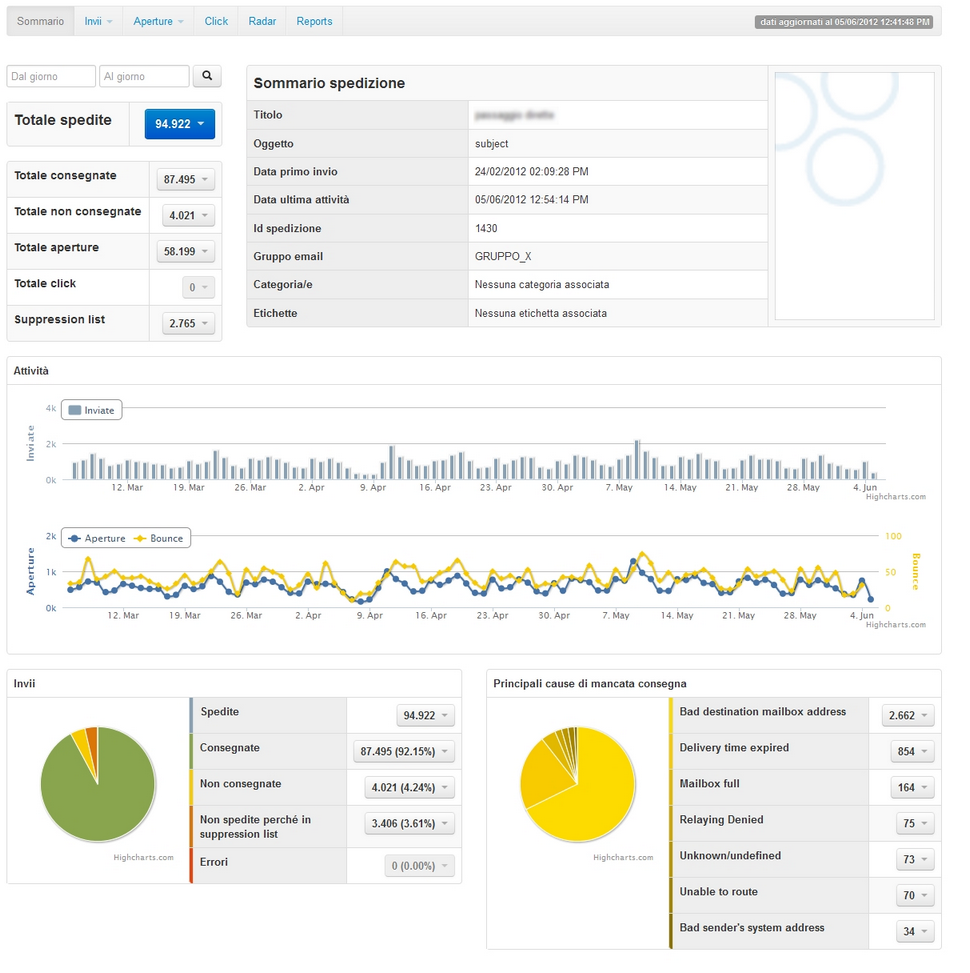
Figura 6
By clicking the arow to the right of Total sent, Totale delvered, Totale bounces, Totale opens, Suppression list you can jump directly to relevant section and download a list of recipients. (v. fig. 7)

Fig 7
Sent Here you find data about sending. Undeer sub-menu “Sent”, “Delivered”, “Bounces”, “Errors”, “Suppression List” you find charts and detailed information.
Sent Data related to sent emails, with descriptions. You find: a chart with emails sent bydomain (fig. 8)
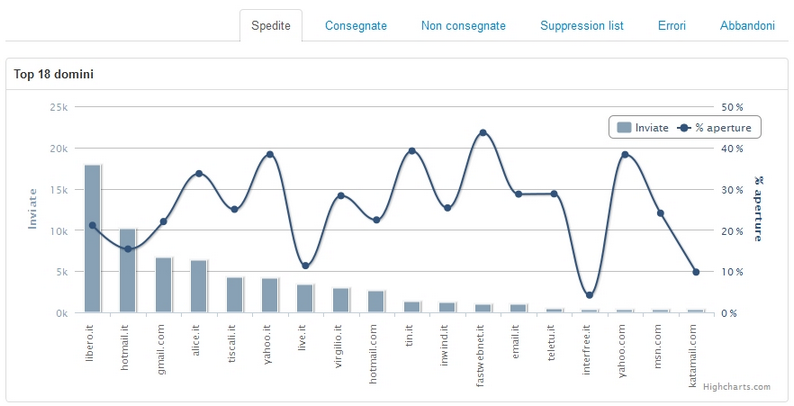
Figura 8
You also have a table with domain analysis (fig. 8) , with values and rates by domain for the main metrics.. You can also change the sorting criterium.

Figura 9
Delivered Here you find data about delivered emails. With a chart and a table by domain (v. fig. 10)
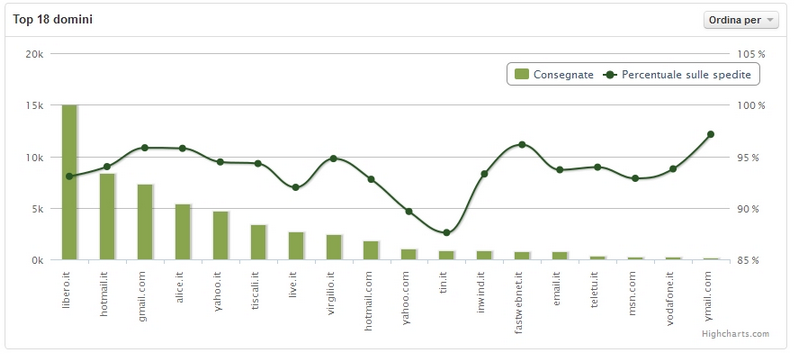
Figura 10
There also a domain analysis tab(v. fig. 11), and you can change the sorting order.

Figura 11
Bounces Here you find details about bounces . A charts shows emails by domain.
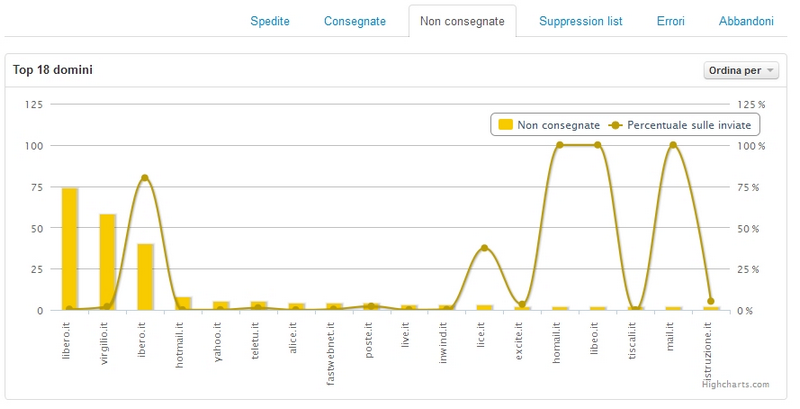
Figura 12
There also a domain analysis tab(v. fig. 13), and you can change the sorting order.
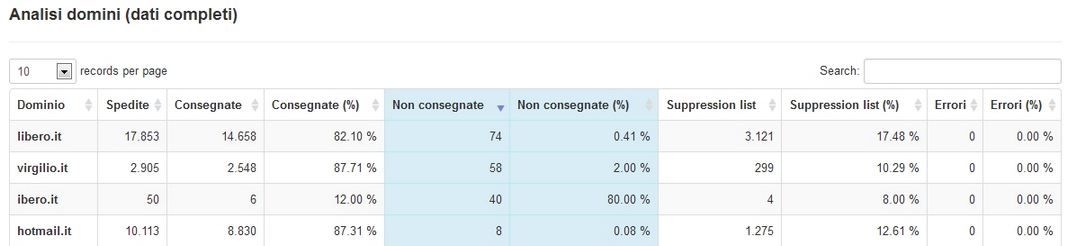
Figura 13

Figura 14
Here is a legenda of number codes of bounces:
0: Unknown/undefined 1: Bad destination mailbox address 2: Bad destination system address 3: Bad destination mailbox address syntax 4: Mailbox has moved 5: Bad sender’s mailbox address syntax 6: Bad sender’s system address 7: Other or undefined mailbox status 8: Mailbox disabled, not accepting messages 9: Mailbox full 10: Message length exceeds administrative limit 11: Reputation block 12: No answer from host 13: Bad connection 14: Routing server failure 15: Unable to route 17: Delivery time expired 16: Routing loop detected 19: Invalid command 18: Other or undefined protocol status 21: Delivery not authorized, message refused 20: Syntax error 23: Service not available – access denied 22: Relaying Denied 24: Message considered to be spam
Suppression list Messages not sent because incuded in the Contactlab Blacklist (fig 15)
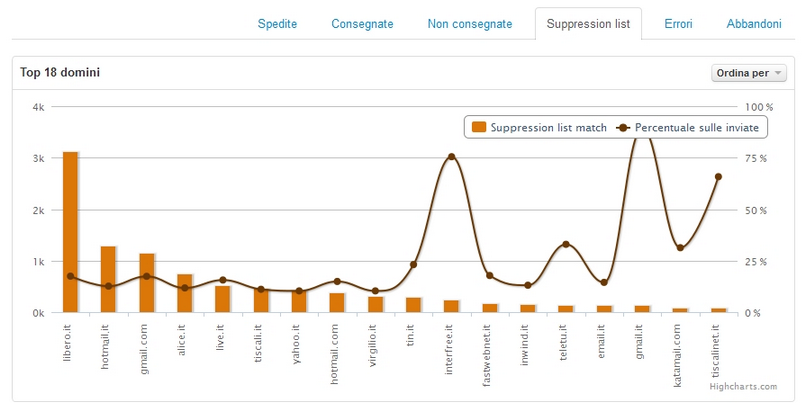
Figura 15
There also a domain analysis tab(v. fig. 16), and you can change the sorting order.
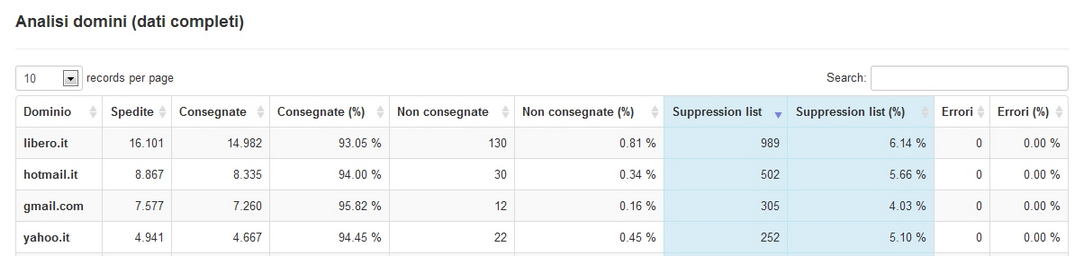
Figura 16
Then you have a chart (fig. 17) with most common blacklisting reasons.
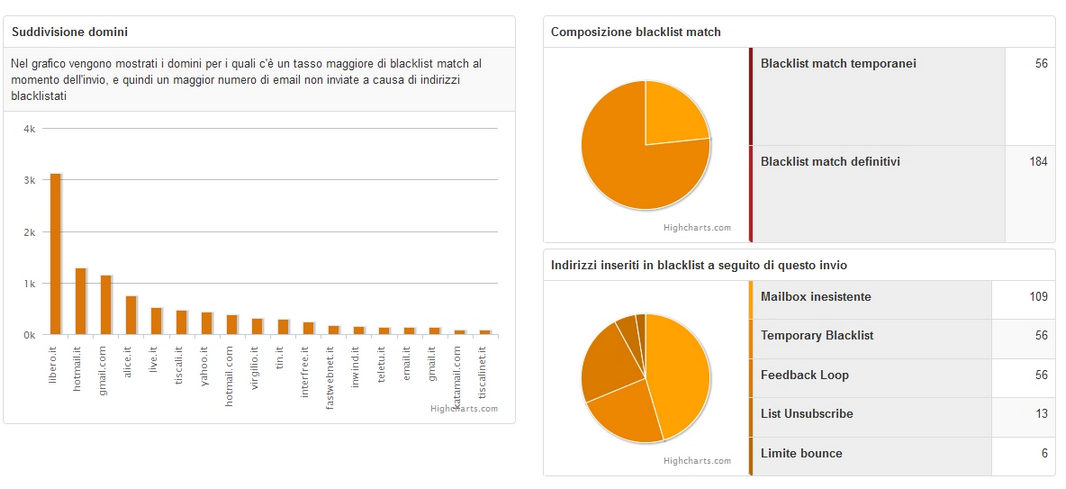
Figura 17
Errors Not available
Abbandons Here you find reasons why users left your user base, like:
- Abuse: users who reported an abuse
- Feedback loop: users who marked message as spam (on hotmail, aol, yahoo, libero)
- List Unsubscribe: Users who used the “List unsubscribe” header parameter to unsubscribe (this causes recipient blacklisting).
- Unsubscribe
In tab “Opens” (fig. 18) you find information about:
- Number of unique opens
- The open rate .
- The number of users who opened the message via webmail, online version (mirror page) and mobile device.
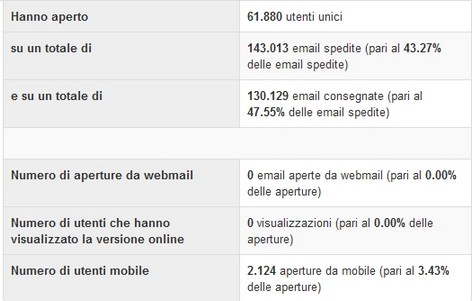
Figura 18
Clicks Here (fig.19) you find information about:
- more clicked links (with total number of clicks)
- glatest clicks (real time)

Figura 19
Radar Find a recipient email address and find its behaviour.
Reports All main reports are grouped here foryour convenience.
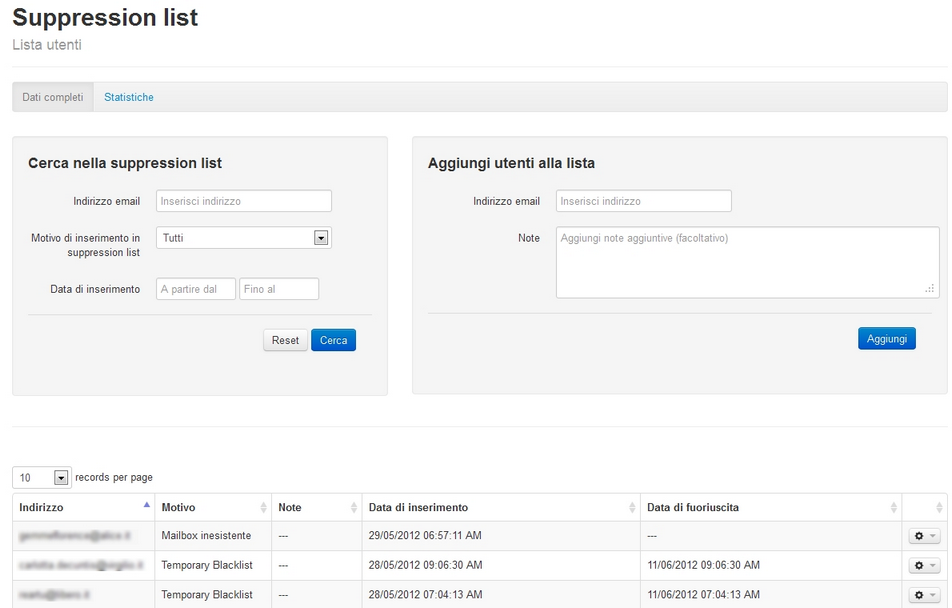
Fig 20
In “Statistics” you find charts about suppression list composition.
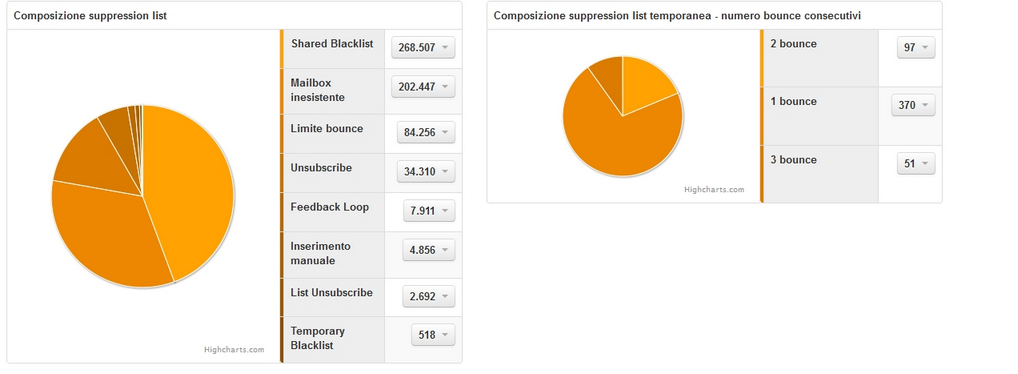
Fig 21
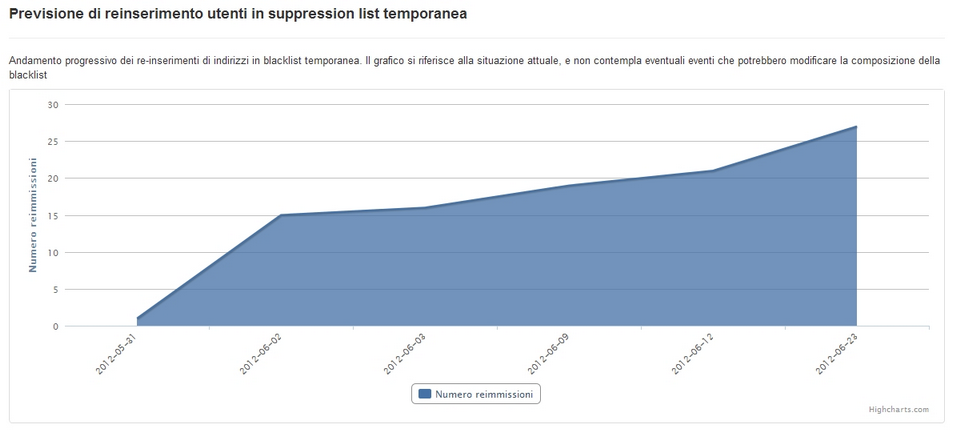
Figura 22