
In this section you can analyze the deliveries contained in the standard groups (groups email / sms / fax) or in virtual groups, or compare the results of multiple shipments in free selection.
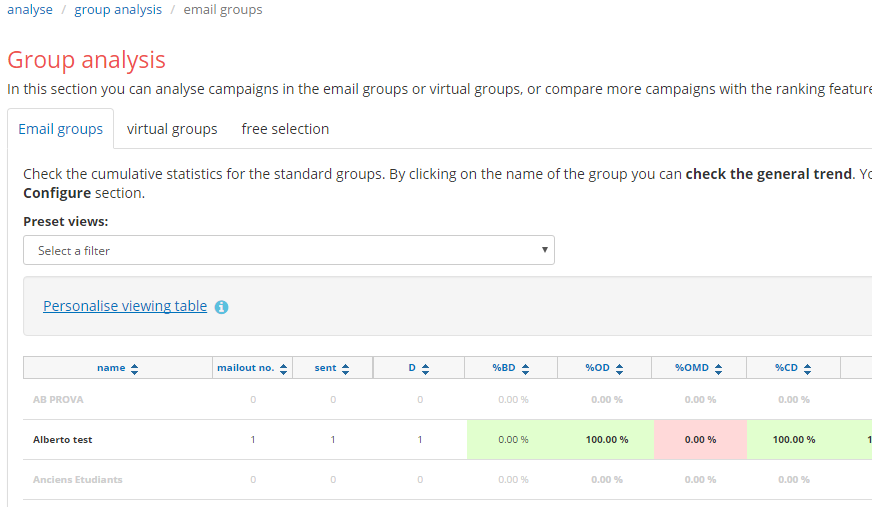
Figure 1
Email/sms/fax groups
In groups email / sms / fax you will analyze statistics on deliveries of a single group. It will be possible to check, compare and analyze performance over time of different deliveries and build a ranking (Fig. 2)
In addition to the tab “Absolute values” there are other that offer statistical percentages, graphs about delivered/bounce/opened/click (Fig. 3), and performance day/hour (Fig. 4)
In days/hours trend (Fig. 4) there are two graphs: the first on days the second on times in which deliveries are made (Fig. 4)
Virtual Groups
In this section we analyze the trend, as regards openings and clicks, the virtual group created in “Configure -> virtual groups”
You can perform the analysis based on specific periods (Fig. 5)
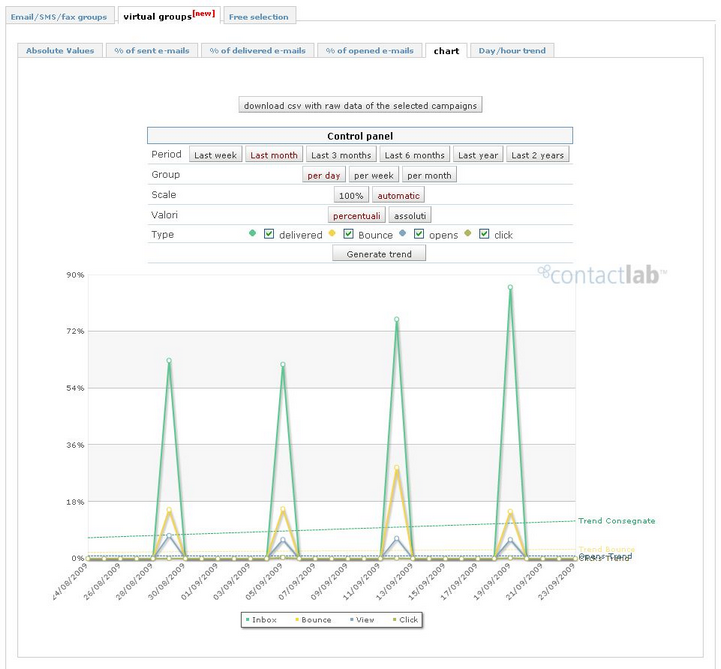
Figure 5
Free selection
In this area you choose every delivery you want to compare, from the tree. (fig. 6/7)
You can also analyze the trend over time of the deliveries selected, for delivered, bounce, openings and clicks