
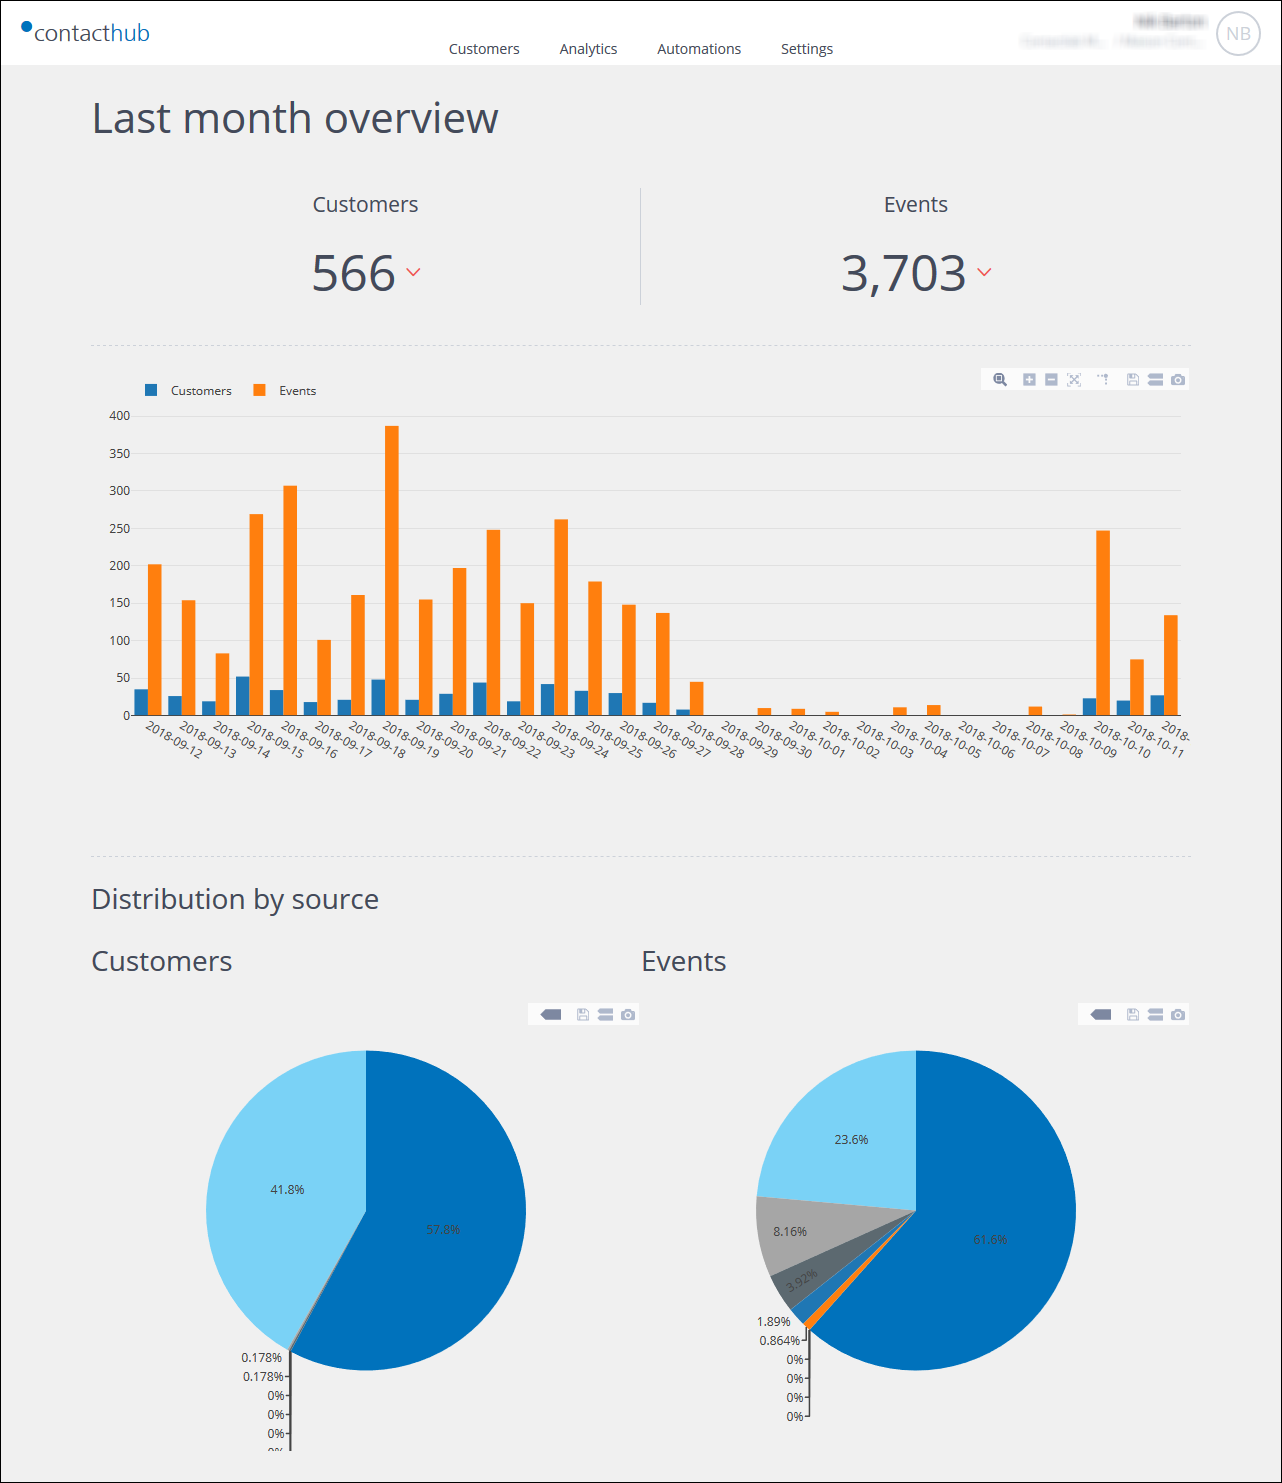
Example of the Dashboard showing the Last month overview
The Dashboard that displays when you log in to Contacthub, or click the Contacthub logo, includes a Last month overview of customer acquisitions and events, for the current node. It is divided into the following panels:
- The number of new Customers and Events recorded in the last 30 days.
Click the arrowheads to view a comparison with the previous 30 days. - The daily distribution of new customers and events.
Use the controls, positioned to the top right of the chart to zoom in or out, scale the view, or download the details as either a CSV format file, or a PNG image. - The Distribution by source of new customers and events.
Use the controls, positioned to the top right of each chart to toggle data pop-ups and the legend, or download the details as either a CSV format file, or a PNG image.
Previous page: Data visualization overview | Next page: The Customers management page