
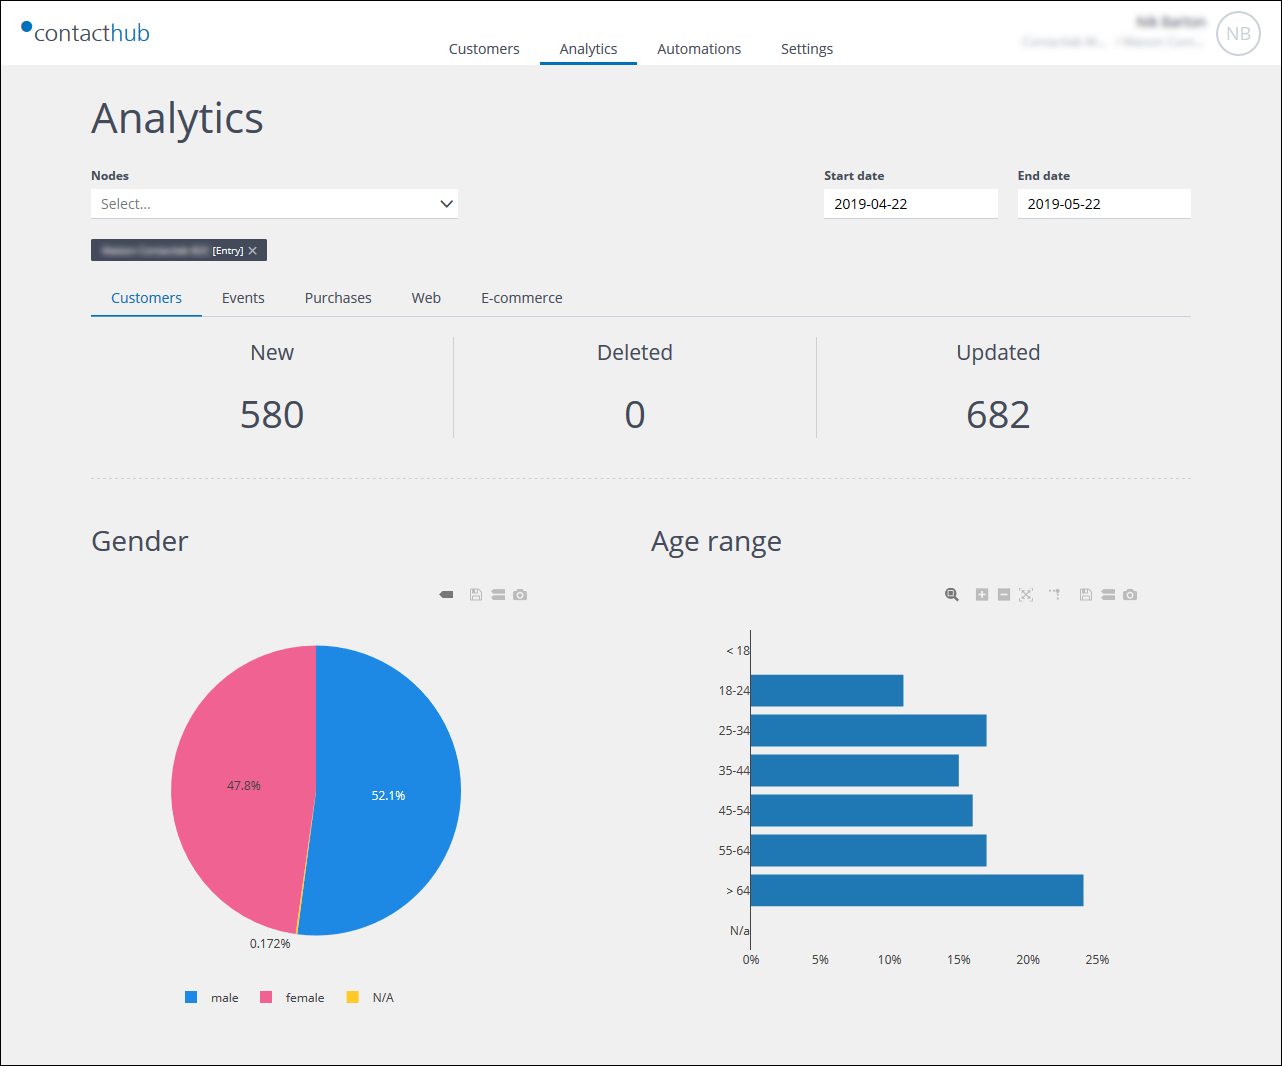
Example from the Customers Analytics page
Click Analytics in the the Control bar to access the Analytics management page. The Customers Analytics page displays by default.
The Analytics management page provides access to a rich set of analytics that enable you to examine the overall customer base composition, the customer acquisition statistics, and a range of information about events, purchase activity, Web behavior and similar.
All analytics pages include:
- A Node selection field.
Enables you to define the nodes that should be included for analysis. - Start date and End date fields.
Enable you to define the analysis period. - A series of tabs, which provide access to the relevant analytics:
If you position your mouse over a chart segment or bar, the UI displays further information, such as the number of customers, the distribution value and similar.
Page panel controls
Towards the top right of each chart-based panel are a series of controls that enable you manage the displayed information. While the available controls vary according to the type of chart, you can, for example:
- Save the relevant chart in PNG format.
- Save the relevant chart in CSV format.
- Pan the displayed information.
- Zoom in or out.
- Autoscale the chart.
- Reset the axes.
- View additional information when you hover your mouse over a particular area of the chart.
A screen tip displays when you position your mouse over a particular control icon, which describes what it does.
Previous page: Deleting events | Next page: Customer Analytics