
To display the Customer Analytics page, if it is not already visible, click the Customers tab on the Analytics management page .
The page includes details about the customer base composition and customer acquisition statistics.
It is made up of the following panels:
- The Customer base summary panel.
Displays the number of New, Deleted and Updated customers.
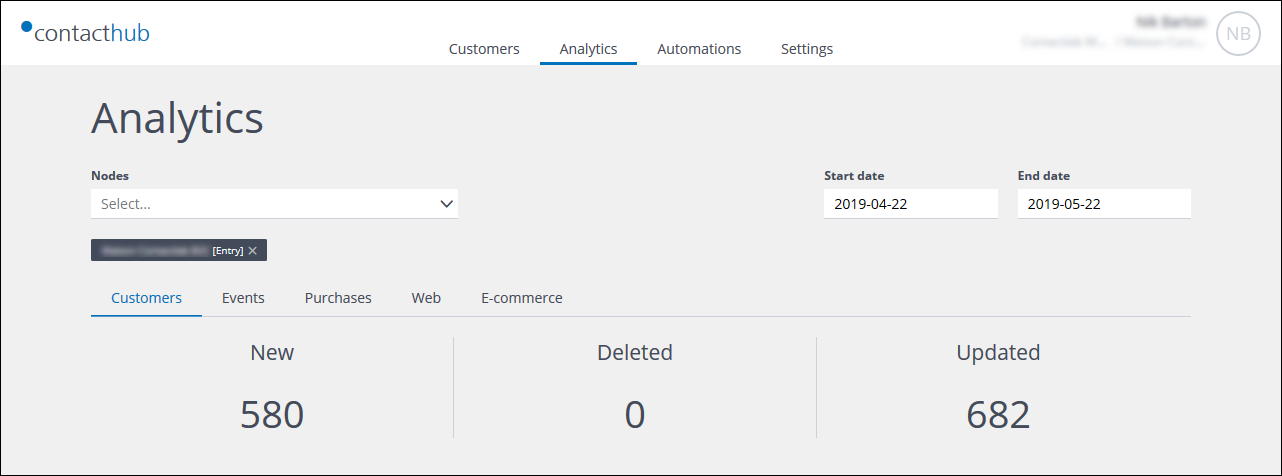
Example of the Customer base summary panel
- The Gender and age range panel.
Displays the gender and age range distribution of the customer base.
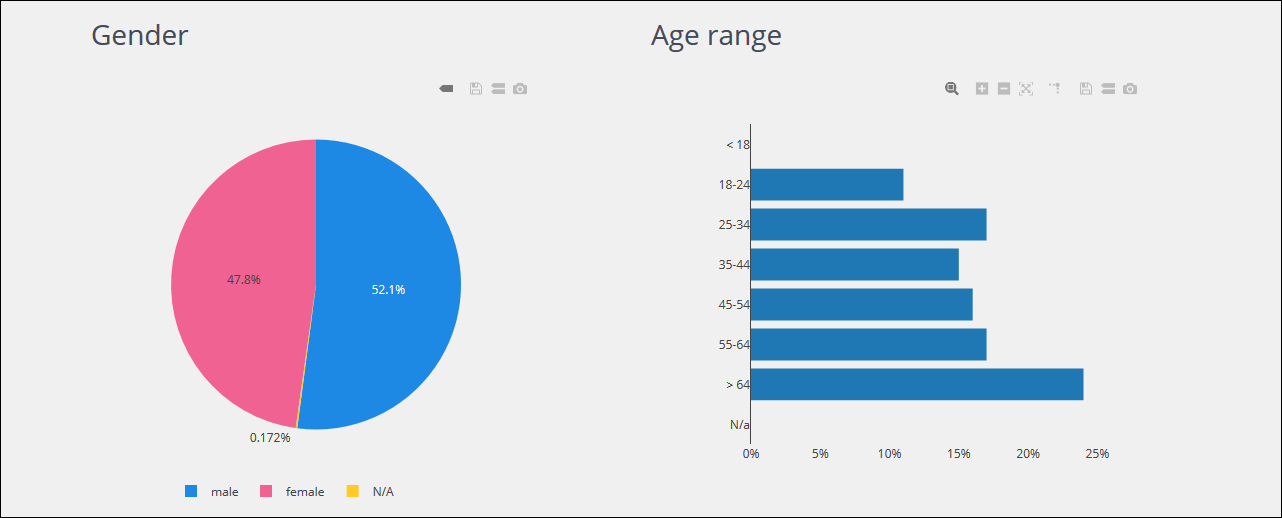
Example of the Gender and age range panel
- The Geographic panel.
Displays the geographic distribution of the customer base.
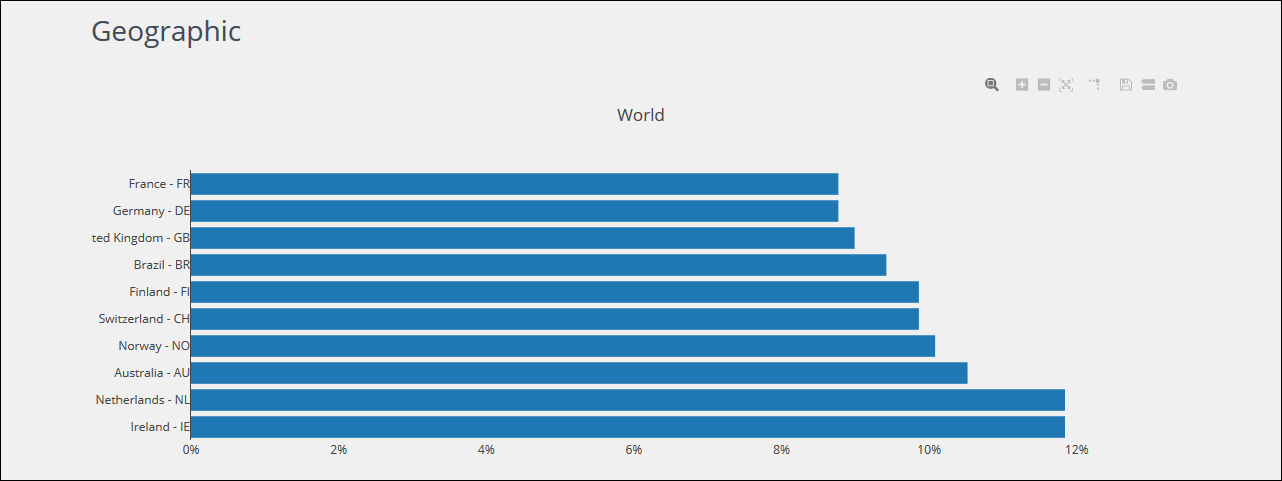
Example of the Geographic panel
If you click on a country, you can drill down to a city-based breakdown of the data for that location.
- The Source and node panel.
Displays the distribution of the customer base by source and node, if more than one node is selected.
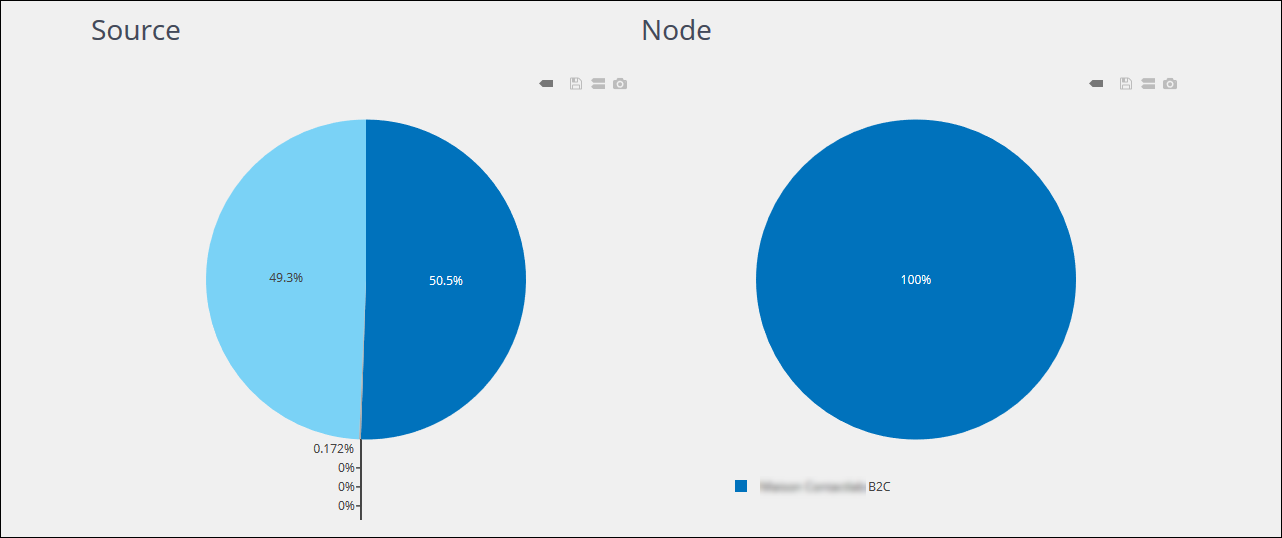
Example of the Source and node panel
- The Acquisition trends panel.
Displays the distribution of new, lost and total customers over the defined period of time.
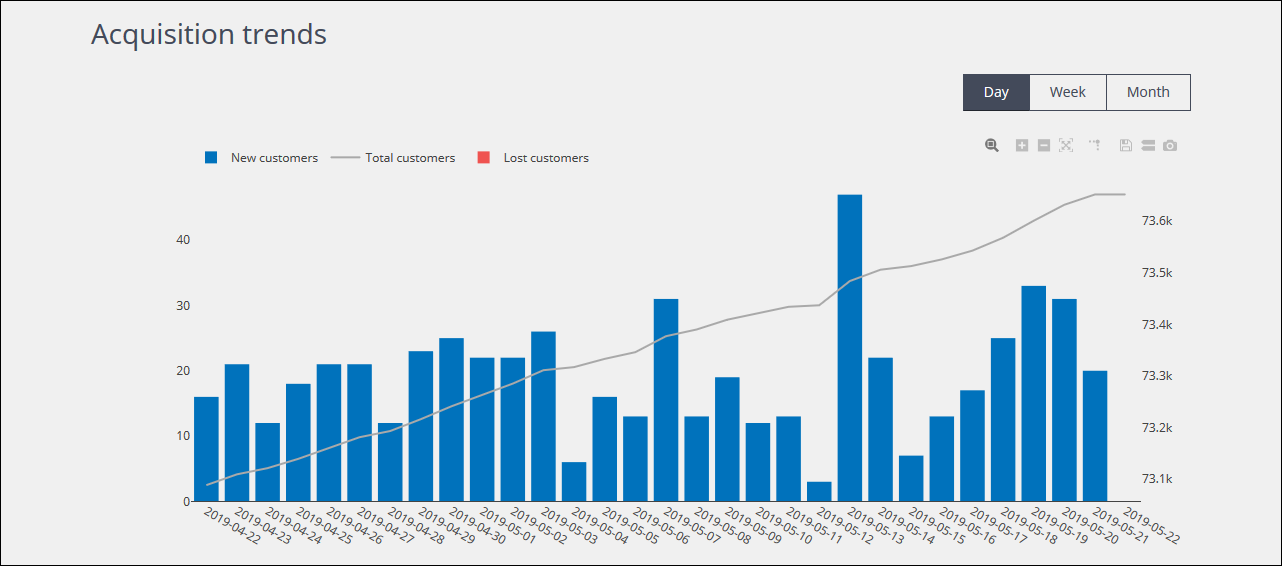
Example of the Acquisition trends panel
You can choose to display the data on a Day, Week or Month basis.
- The Acquisition heatmap panel.
Displays the customer acquisition distribution, on an Hour of the day, Day of the week or Day of the Month basis.
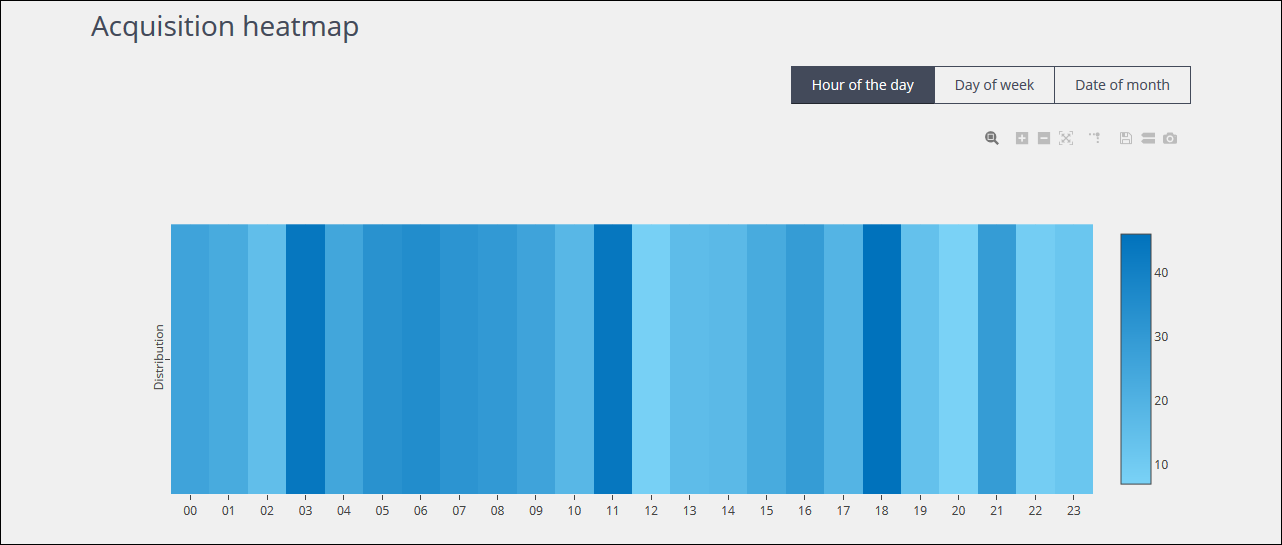
Example of the Acquisition heatmap panel
Previous page: The Analytics management page | Next page: Event Analytics